




A centrifugal pump curve compresses the complete hydraulic behavior of a pump into one sheet, yet misreading it remains one of the most expensive habits in industrial procurement. Pumps specified at the wrong point on the curve run for years at low efficiency, vibrate themselves into premature bearing failure, or cavitate quietly until the impeller loses material. Every diagram reflects rigorous certified performance validation, providing measured test data that every selection decision should trace back to. This guide walks through each curve on a standard manufacturer diagram, explains how the piping network fixes the actual operating point, and shows how to use that reading to specify impeller trim, motor power, and control strategy for a new installation.
What a Pump Curve Actually Represents
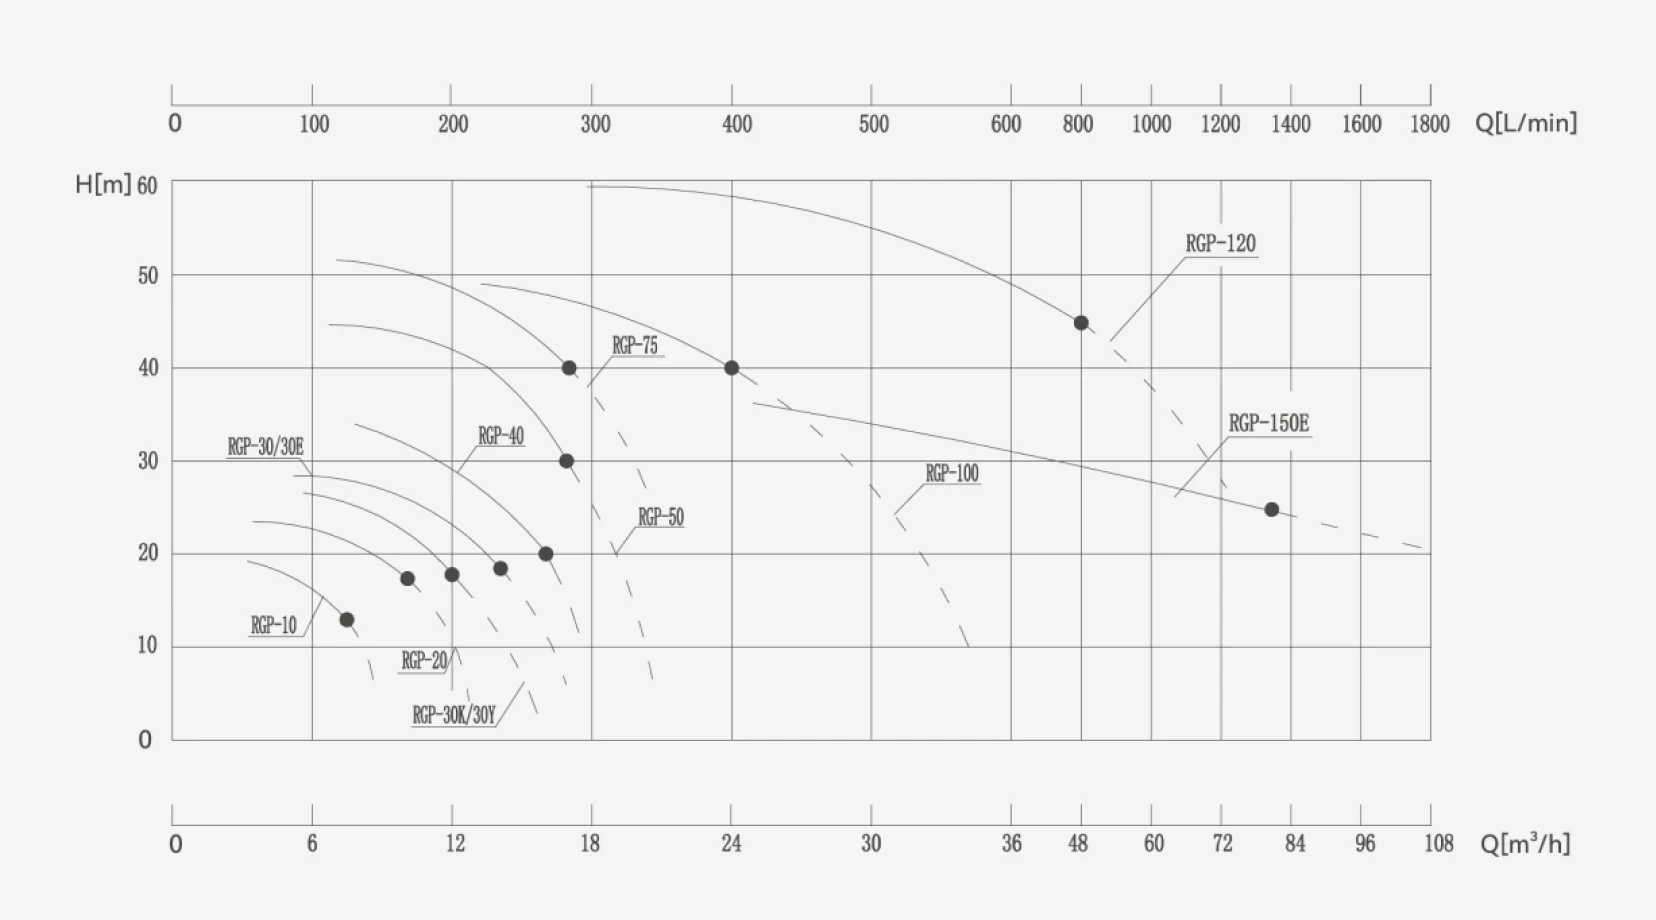
A published performance curve records the results of a standardized acceptance test, typically executed per ISO 9906 or HI 14.6, on a pump operating at a fixed speed with a specific impeller diameter. Four relationships are plotted against flow rate on the horizontal axis: developed head on the primary vertical axis, efficiency, absorbed power, and NPSH required. Each curve answers a different engineering question, and reading only the head-flow line while ignoring the other three is the root cause of most specification errors. The curve is valid only for the tested speed and impeller diameter; changing either shifts every line on the diagram in a predictable way governed by the affinity laws.
The Head-Flow Curve: From Shutoff to Runout
The head-flow curve is the backbone of the diagram. Reading it from left to right, three reference points matter:
● Shutoff head: The head developed at zero flow, with the discharge valve closed. This is the maximum pressure the pump can generate at that speed and impeller diameter. Continuous operation at or near shutoff recirculates fluid inside the casing, overheats the pump, and loads the bearings radially; it is a test condition, not a working point.
● Best Efficiency Point (BEP): The flow at which the pump converts the highest share of shaft power into useful hydraulic work. At BEP, flow enters the impeller at the design angle, radial loads on the shaft reach their minimum, and vibration and noise are lowest.
● Runout: The far right end of the curve, where head falls steeply as flow rises. Operating near runout drives NPSH required sharply upward, overloads the motor, and erodes the impeller through severe vibration.
The Efficiency Arc and Off-Peak Penalties
The efficiency curve rises from zero at shutoff, peaks at BEP, and declines toward runout. Its practical meaning is energy cost. A pump sized for a duty point well left of BEP wastes the efficiency gap on every operating hour for the life of the installation. If you are focused on optimizing power consumption across your facility, plotting the duty point on candidate curves and reading the efficiency at that exact flow is critical, rather than comparing the headline peak efficiencies printed in brochures.
NPSH Required and Cavitation Risk
The NPSHr curve states the minimum suction head the pump needs at each flow to avoid pressure drops that cause fluid boiling. Because NPSHr climbs steeply beyond BEP, a unit that is safe at its normal duty point can fail during a system upset that pushes it right on the curve. Cross-checking the available NPSH against the required NPSH is the step that determines impeller life. For more detailed mitigation strategies, see our guide on identifying and eliminating vapor implosions.
Power Curves and Motor Sizing
For most radial impellers, absorbed shaft power rises with flow. First, the motor must cover the maximum power anywhere on the allowable operating range, not just at the duty point, because operators will eventually open valves and push the unit right of BEP. Second, starting against a closed discharge valve draws the lowest power, which is why closed-valve starting protects motors on large installations. Selecting motor power directly off the end-of-curve value eliminates overload trips.
System Curves Decide the Actual Operating Point
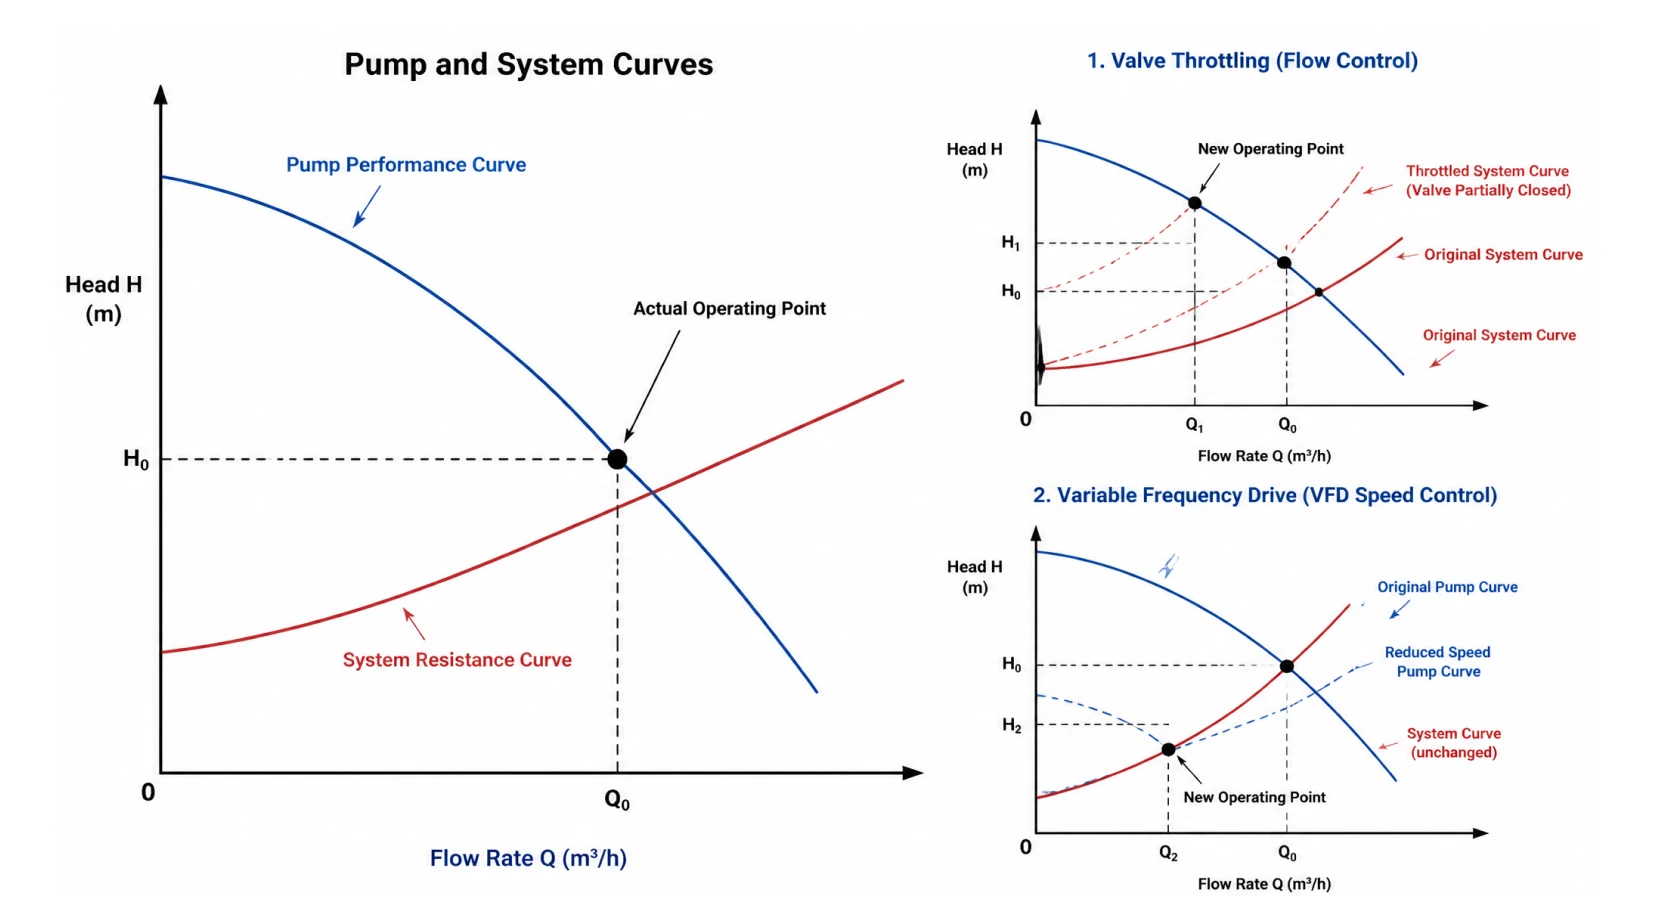
The performance diagram alone does not set the operating point. The network resistance line, built from static head plus friction losses, represents what the piping demands. The equipment settles exactly where the two lines intersect. Throttling a discharge valve adds artificial friction, steepens the resistance line, and moves the operating point left toward shutoff at the cost of burned energy. A variable frequency drive instead scales the entire performance curve downward. Reducing flow to 80 percent by speed cuts absorbed power toward roughly half of the full-speed value.
Impeller Trim Lines for Precision
Published diagrams often show several nested curves for one casing, each representing a machined impeller diameter. Instead of accepting a full-diameter impeller and throttling the excess pressure away, the impeller is trimmed so its curve passes directly through the required point. The trim also sets the future upgrade path, since a casing bought with a trimmed impeller retains headroom to restore capacity later.
A Field Verification Checklist
Before finalizing a purchase, verify these items in order:
- Confirm the test standard, speed, and fluid (water at 20 °C needs correction for viscous fluids).
- Plot the duty point and confirm it sits within 70 to 120 percent of BEP.
- Read efficiency at the exact duty point.
- Check NPSHr at the maximum expected flow and hold a margin against NPSHa.
- Size the motor against the power at the end of the curve.
- Record the selected trim and remaining headroom.
Next Steps for Your Fluid Transfer Projects
If you are learning the underlying fluid dynamics of this technology, mastering these elements is essential. Aulank Pump publishes tested diagrams for its entire dynamic equipment catalog, including robust fluid transfer units designed for demanding applications. If you need an optimized selection for a new line, submit your duty parameters to our engineers, and we will return a perfectly matched model with a complete performance report.